Required result: infographic + description of the design process and an explanation of the application of learning theory and individual contributions
Infographic
The scientific concept we choose is coral bleaching. We wanted to aim this infographic at teenagers/young adults (age range 14-22), because we think with this age group we’ll have the best chance that they pick up on this information and will do something with it. A lot of young people are fascinated by coral reefs and tropical places, and might even have swimming there on their bucket lists. If we can tell them coral reefs might not be there anymore when they have children or grandchildren, it might be enough to have them take some kind of action.
Description of the design process
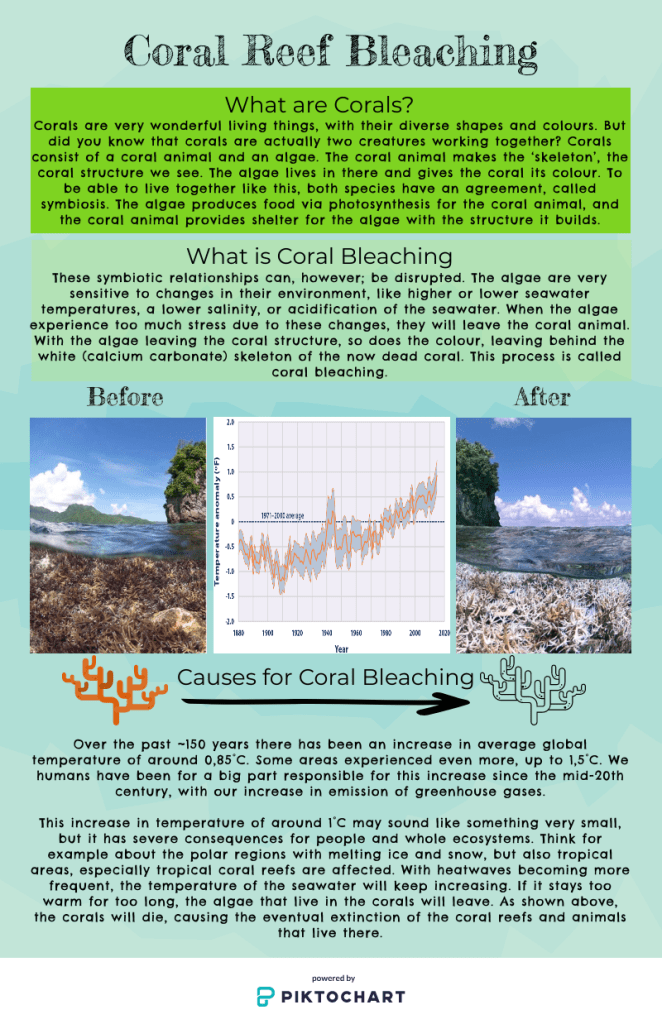
Marine biology is Wendy’s background, and we went with a scientific concept that’s part of her background, but that also ties in with the climate issues we have today. We had this idea in mind to have the concept of corals and coral bleaching in the middle, and then put more information into boxes linked to that. But this initial design became too text heavy in the middle, which made it unclear. We then decided to put the information at the top and the bottom, and have the process of bleaching made visible with the use of pictures. We also added a graph to show the increase in ocean surface temperature. Sadly, we couldn’t find a good one that had the temperature in degrees Celsius, so that it’s in Fahrenheit might cause some confusion.
Application of the learning theory
I think cognitivism is what would apply to our infographic -> (Attention + deep processing)
6 key concepts in stimulating meaning full learning
•Clear structure In the material
•Correct level of the subject matter
•Give meaning to subject matter
•Individual accountability
•Visibility of learning and thinking
•Stimulate Motivation
In our infographic we wanted to begin ‘simple’ with an explanation of what corals are, since most people won’t be familiar with that. Then we’re going slightly deeper into the topic with the phenomenon ‘coral bleaching’, which is something that happens on a large scale now, and how it ties in with the current climate warming.To make the explanation better understandable we tried to visualise the text with pictures.
Since the topic, coral reefs, is something most people know about, we tried to activate their prior knowledge with the pictures, and the general introduction.
Individual contribution
Together we decided on the design of the infographic. Wendy wrote the text for the infographic, and David made the infographic and searched for pictures. Then we wrote the report together. SInce there were only two of us in the group we felt it easier to each contribute one aspect and consult each other to make final decisions.